In short :
A comparison of 51 graphics cards, that are supported under Windows XP.
I mixed older ones with newer ones for better show of their hierarchy at the same settings and with as little CPU/platform limits as possible.
PLATFORM :
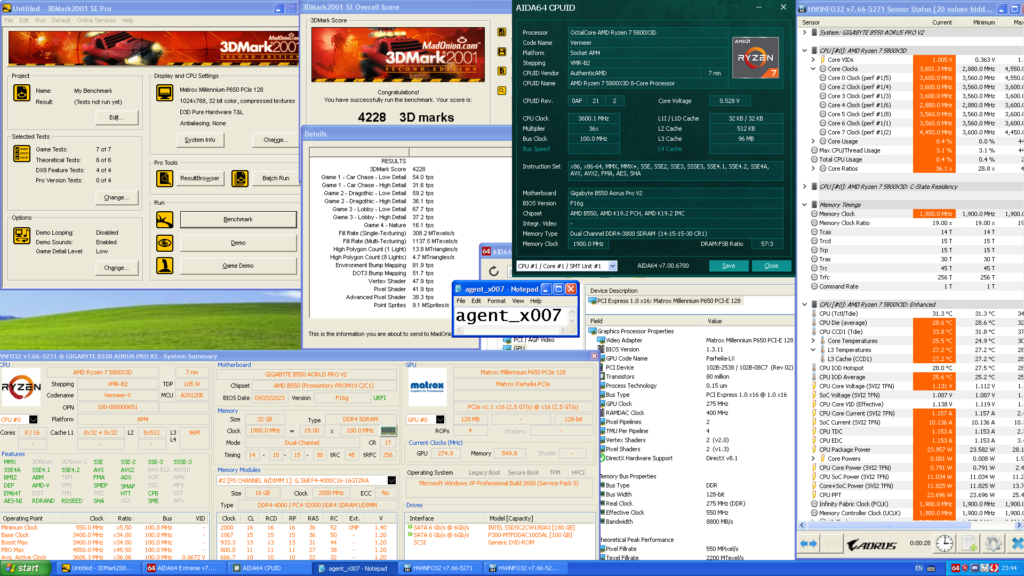
CPU : Ryzen 7 5800X3D (1900MHz FCLK),
Cooler : Thermalright Burst Assassin 120 + 1x Delta AFB1212SH
MB : Gigabyte B550 Aorus Pro v2 (latest BIOS for January 2024)
RAM : 2x 16GB @ 3800MHz CL14.15.15.30 1T (GDM enabled)
Sound : X-Fi Titanium Fatal1ty Champion (SB0880) or NV integrated audio (all EAX effects were disabled in actual games)
SSD OS/Programs : Intel 520 180GB
SSD Game(s) : Micron RealSSD P300 100GB
Software :
OS : Integral version of Windows XP SP3 x86 [32-bit] (patched to support newest platforms)
Programs :
3DMark 2001 SE
3DMark 2003/05/06 (default settings), Unigine Heaven 3.0 (Custom : DX9, High Shader, Anisotropic Filtering : 16x, no AntiAliasing, 1920×1080)
Fillrate Benchmark v0.92 (default settings, 1024×768).
Games :
Half Life 2 : Lost Coast, Far Cry 1 (D3D only), FEAR(1), DOOM 3, and Crysis utilizing either build-in timedemos or 3-rd party free benchmark tools.
ATI’s drivers :
1) Catalyst 9.1 or FireGL equivalent with CCC (DX9b/c + early DX10)
2) Catalyst 11.6 with CCC for HD 4770/4890 (and most DX11 cards)
3) Catalyst 14.4 (moded “pack2”), for R7 250X and FirePro W5000.
Nvidia drivers :
1) 169.96 for Quadro FX 5500
2) 175.19 for GeForce 7900 GTX
3) 340.52 for DX10 and most* of DX11 cards
4) 368.81 for *GTX 750 “GM206”
Sample screenshot of platform settings :
Warning :
ALWAYS check what frequencies specifc card was running at during tests (both Core and VRAM).
I adjusted most of them because I wanted to target specific frequencies.
Because of this, some are overclocked, while others are downclocked.
I wanted to test cards of similar build/process technology at close to, or exactly he same, frequency setting (to get proper grasp on what’s better at architecture/building block level). It’s possible to extrapolate results with some math (example : 10% lower core clock on your card = ~10% lower score than mine [actual performance will be lower since it’s also based on how much VRAM bandwidth is a limiting higher core frequency]).
Finally, results.
I will use this first graph to write what GPU information is available :

As much information as possible was added near card’s name. Short summary of that :
[GPU model name] [VRAM capacity] [VRAM generation**] [VRAM bus width] [OC***](Core clock/[shader*][turbo frequency*][geometry clock*]/VRAM clock [always REAL frequency and not effective]).
*Depends on card, as some have seperate shader clock, or have Turbo Boost enabled or (in G7x generation case of NV) a seperate Geometry clock.
**Most cards use (G)DDR3 memory (those are not marked, to reduce graph’s text clutter), while all others that utilize GDDR4, GDDR5 or DDR2 memory are marked as “G4” “G5” and “G2” respectively.
***(OC) in cards name was added to indicate a significant increase of performance from reference card due to very high overclock applied to both GPU and VRAM.
Notes about names :
FireGL V7350 = ATI X1800 XT (1GB GDDR3)
FireGL V5600 = HD 2600 XT (GDDR4)
FireGL V7600 = HD 2900 Pro
FirePro W5000 = HD 7850 “LE” (“LE” = 3/4 of GPU shaders that are clocked lower, along with downclocked memory)
Quadro FX 5500 = 7900 GTX 1GB (but with DDR2 VRAM vs. GDDR3 on regular one)
“GM206” near GTX 750 name means a card that utilises Maxwell 2.0 chip (GM206), instead of the usual Maxwell 1.0 (GM107). It’s also the only Kepler card that has Turbo Boost enabled (others either don’t have it, or I disabled it via vBIOS mod).
Since you read this far, here’s some more graphs 🙂


Below, 3DMark 06 overall score was omitted for easier comparison between different platforms (since final score get’s “adjusted” by CPU Score result).
I opted instead to make two graphs of GPU sub results (SM2.0 and SM3.0) :


Unigine Heaven 3.0 detailed settings :
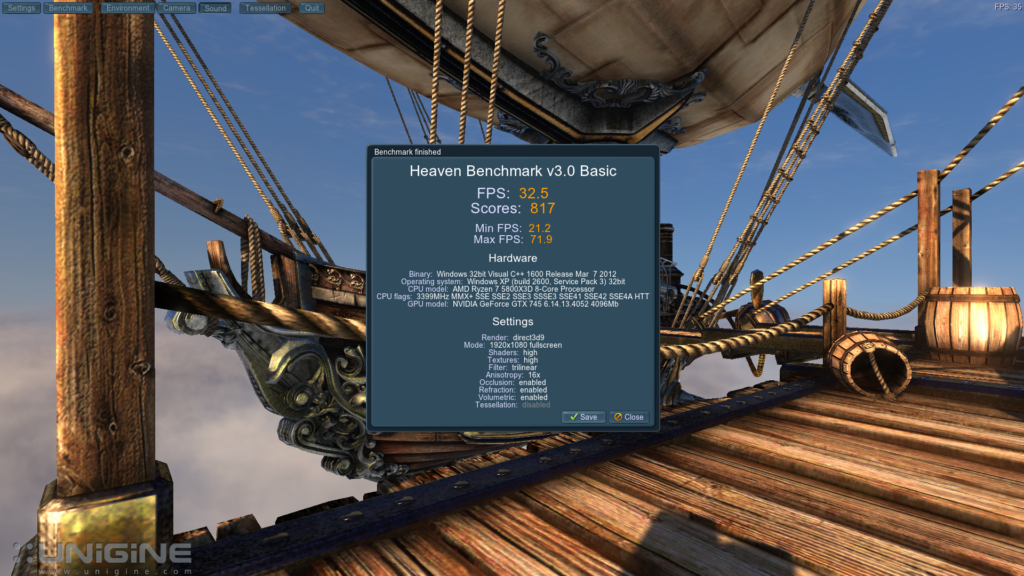

*About DX9b/c cards in Heaven 3.0:
All cards had graphical glitches/artifacts.
**7900 GTX couldn’t run it at all due to too low VRAM error (it could run it in general, just with glitches and at max. 1280×1024 resolution).
Last synthetic test is Fillrate Benchmark v0.92. Here’s an example of what result from it looks like :
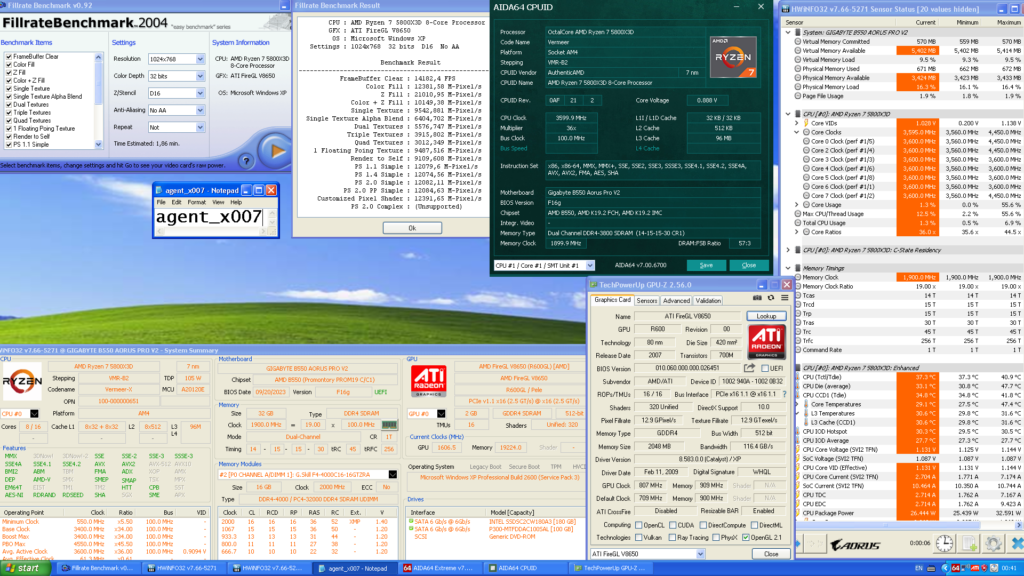
In short : For graph, I used a geometric mean of three sub results from it.
To be more precise : Color + Z fill, Single Texture Alpha Blend, and Quad Textures.

Card performance in this test depends on multiple factors, aside from pixel pipelines available (on earlier cards, 1x pipeline = 1x ROP), adequate memory bandwidth is needed for optimal result. Another variable (on later cards) is SM block count (as can be seen in difference between GTX 660 and GTX 660 OEM case).
But moving on to games…
First game test, Half Life 2 : Lost Coast (benchmark version), engine build date : April 6 2006 (2707)
It’s quite old, but I removed FPS limit via console command.
Here’s example of DX7 settings + results :
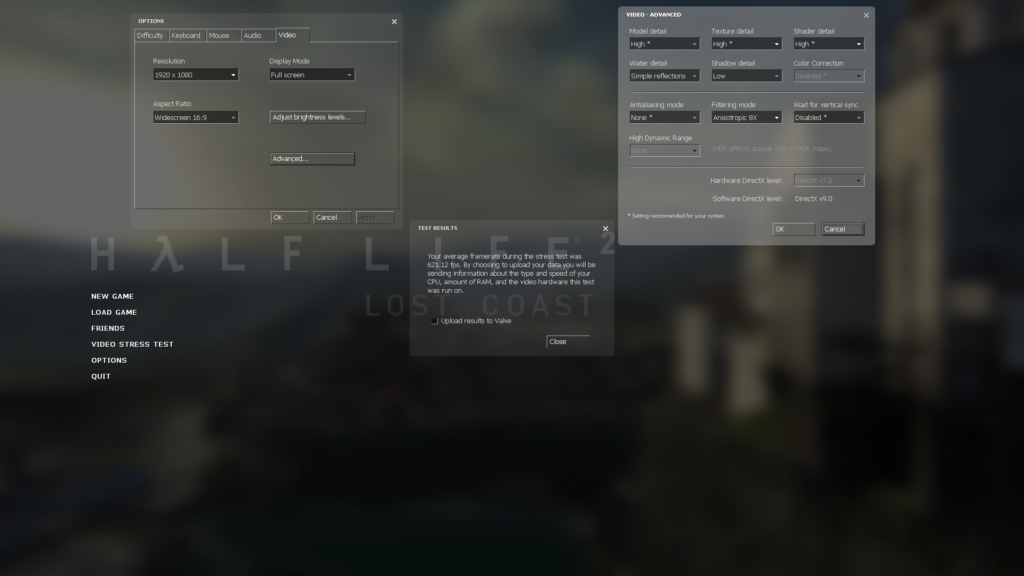

Half Life 2 LC DX8 settings :
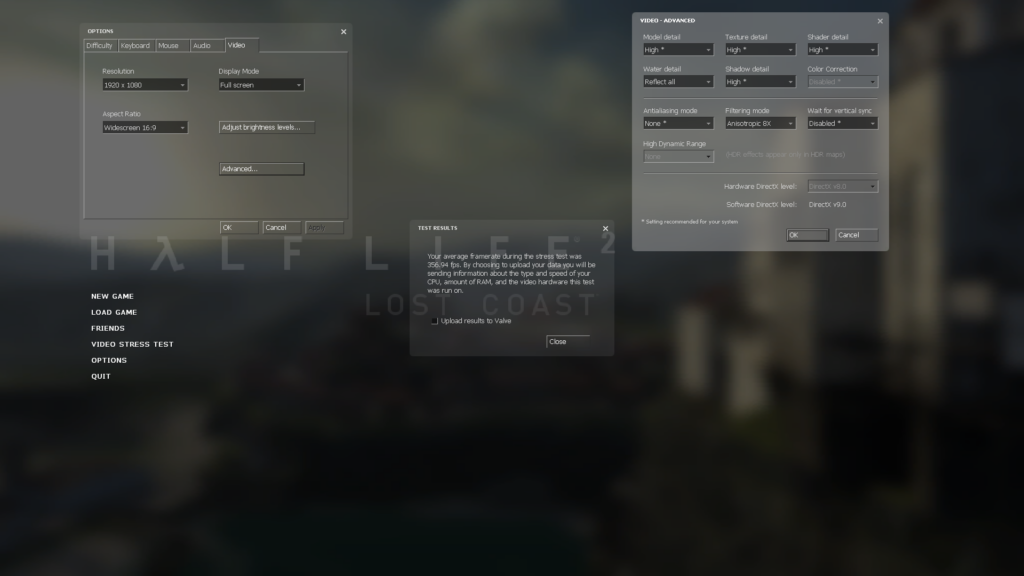

Half Life 2 LC DX9 settings :
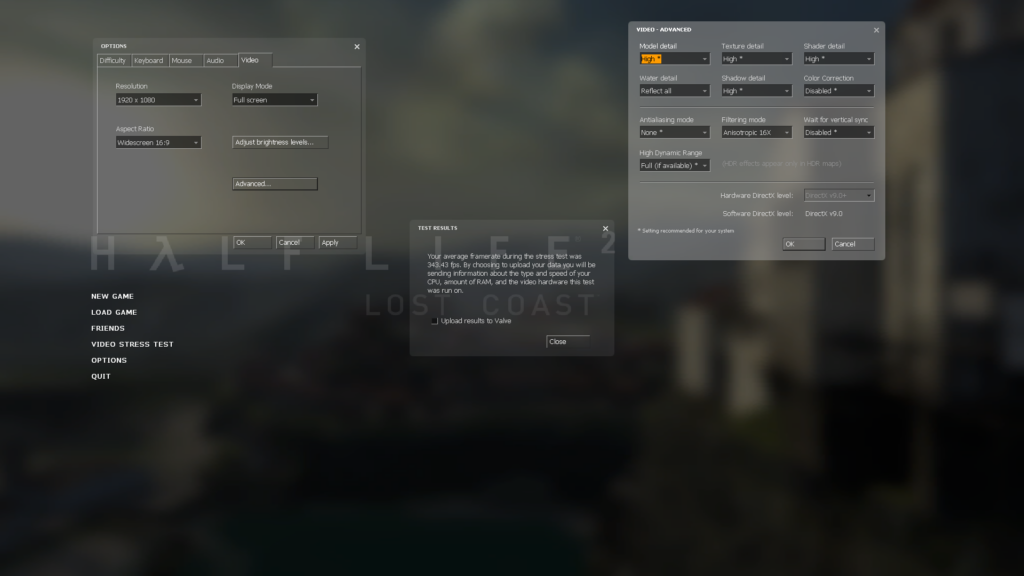

Lost Coast DX9 test doesn’t have results for ATI’s DX9b/c cards because it wouldn’t finish (simply crashed – on DX9c cards), or it wasn’t using all features required by set settings (like HDR/DX9c mode – X850 XT PE).
Doom 3 v1.0, a timedemo was ran with enabled preload option (“timedemo demo1 1” command), “Ultra” preset with no AntiAliasing and 1600 x 1200 resolution.

Far Cry was tested with HOC benchmark tool using GOG version of the game Settings [result is Avg. FPS from three runs] :
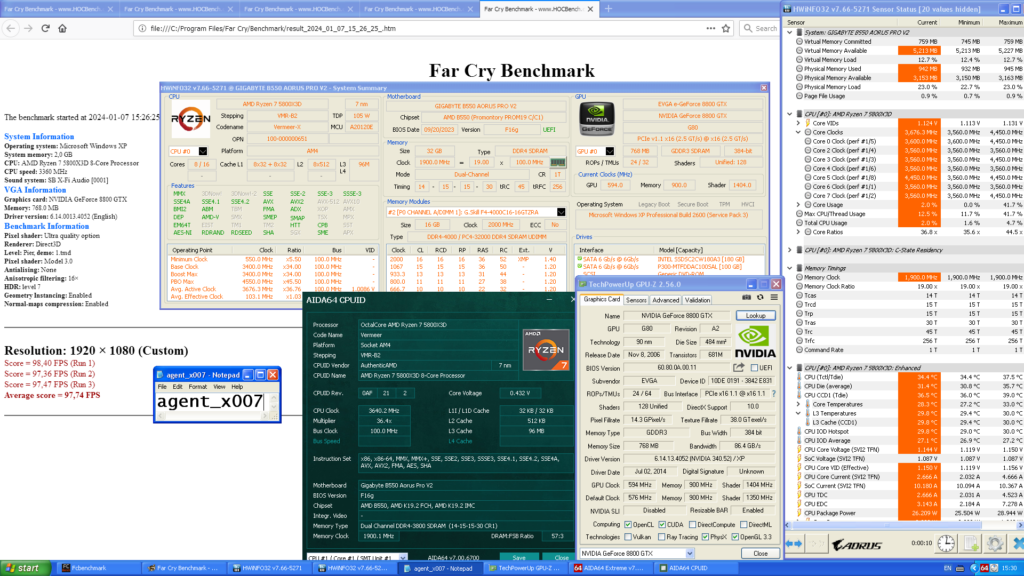

(**DX9c required, so no score for X850 XT PE).
F.E.A.R. First Encounter settings : Maximum/Maximum(Custom, no AntiAliasing, Anisotropic Filtering @ x16), 1920 x 1080.

Crysis was tested using it’s Benchmark Tool (v.1.05), with multiple presets and two test maps (GPU Benchmark + Assault Harbor). Last map was run only with Medium preset.


*Crysis “High” preset requires DX9c support to show all effects used by it (again, disqualifying X850 XT PE card).
Lastly, geomean average FPS for *all games (*without HL2;LC, since it would lower accuracy of it too much [geomean doesn’t work with “0 FPS” values) :

Radeon X850 XT PE score was adjusted for Far Cry and one Crysis test to “1.0” FPS (from 0), to get proper score under geomean math. Which probably shows it in better light than it should be. Other than that, above graph may be skewed by really high FPS of other Lost Coast tests.
In short : DO NOT expect tested GT 710 2GB 64-bit GDDR5 to always hit 60 Avg under similar image/performance settings and similar platform.
For anyone that would like to see more DirectX9c cards on graphs, havli from Hardware Museum has you covered : http://hw-museum.cz/article/3/benchmark-vga-2004—2008–2012-edition-/1
For anyone that would like to see more DirectX9c cards on graphs, havli from Hardware Museum has you covered : http://hw-museum.cz/article/3/benchmark-vga-2004—2008–2012-edition-/1
If you want to ask some questions, feel free to do so in The Retro Web Discord server.
Thank you for time 🙂